25 June 2025 | Qimtek Ltd
Qimtek Contract Manufacturing Index Quarter 1 2025
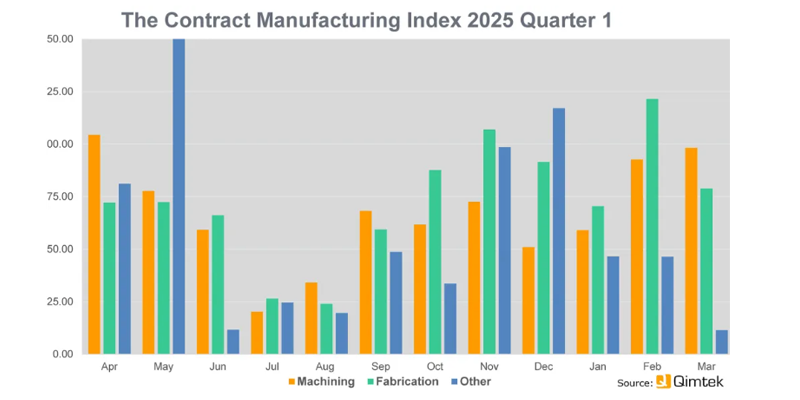
The Q1 2025 Contract Manufacturing Index saw a strong start to the year, with the index up 52% from the previous quarter. There was a flurry of activity in January by both buyers and suppliers. However, this momentum waned as March saw a significant drop-off in activity.
The Index is split into three processes - Machining, Fabrication, and Others.
2025’s data for Quarter 1 is collected from 217 companies and 362 projects.
Quarter 1's Index increased by 52% against the preceding quarter.
Machining
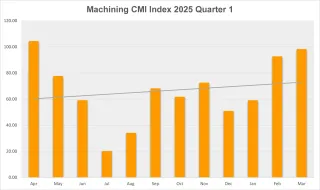
55% of second quarter projects were from machining processes.
The buyers of machining processes have a total outsourcing value of £11,371,765.
The index for machining is up 35% from previous quarter and but down 22% on previous year
Fabrication
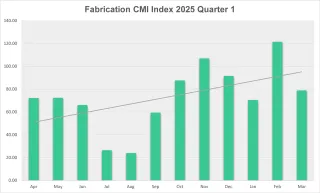
36% of second quarter projects were from fabrication process
The buyers of fabrication processes has a total outsourcing value of £12,170,603
The index for Fabrication is up 54% on last quarter and 28% down on last year's figures.
Other
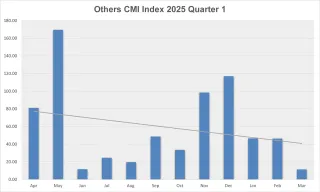
9% of second quarter projects were from other processes
The buyers of other processes has a total outsourcing value of £3,746,100
The index for Others is up over 100% on last quarter on last year’s figures
Lead Times
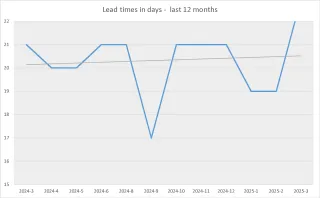
The lead times dropped in January and February which are also the most active months for quoting. When activity dropped off in March, the lead times went up
Industry
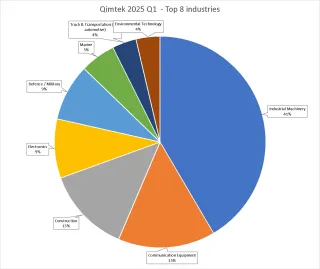
Industrial Machinery is again the largest sector with communication equipment beating construction this quarter.
About Contract Manufacturing Index
The Contract Manufacturing Index (CMI) has been developed to reflect the total purchasing budget of companies that are looking to outsource subcontract manufacturing of custom made parts in any given month.
This reflects a sample of over 4,000 companies, who have a purchasing budget of more than £5bn and a supplier base sample of over 7,000 vendors, with a verified turnover in excess of £25bn.
We measure this by extracting data from the projects we receive from manufacturing purchasers who have an active need for the services of subcontract engineering suppliers.
Since 2016, we have published the index quarterly and this report is a summary of our findings for the this current quarter. In order to shed more light on the emerging trends, we have also broken this down by process and industry.